Please wait
ESG Platform ETEN Request a demo

Sustainability reporting · ESRS · CSRD

Sustainability reporting you control yourself

ESRS data collection, calculation and reporting in one browser-based system. The content is shaped by your administrator – not by a developer.

Request a demo

Demo access on request – write to us and we will send you a login. Open the demo →
  • ESRS
  • GHG Scope 1–3
  • Group roll-up
  • European languages
gis.sea.ee/esg
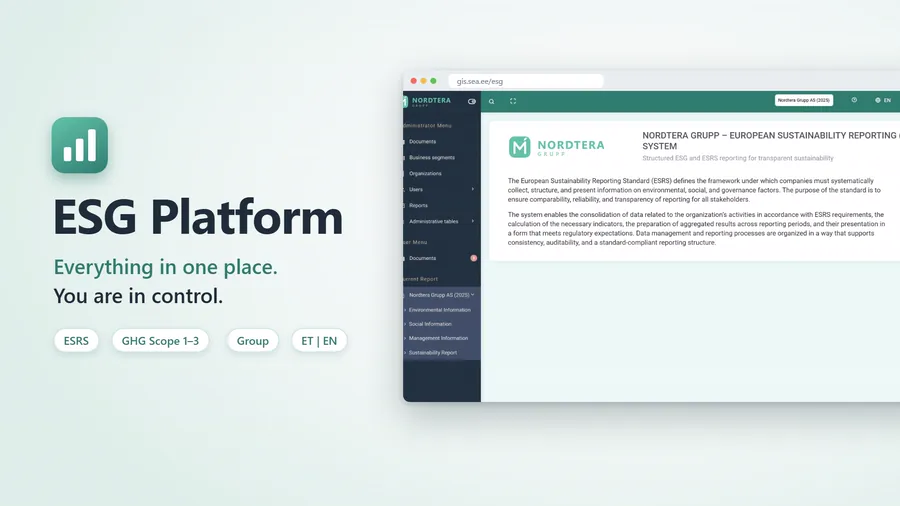
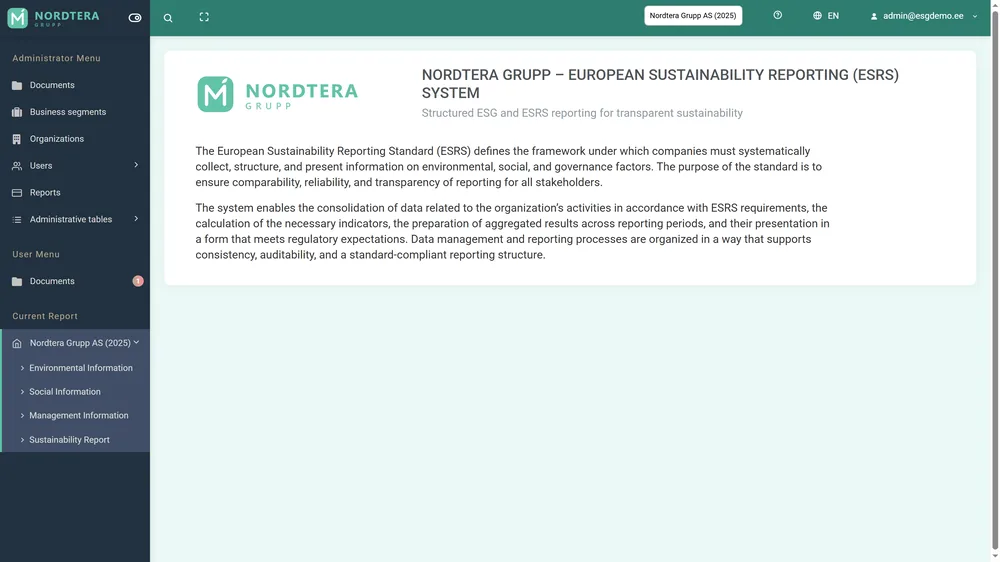
ESG Platform home page with the demo company Nordtera Grupp AS
Scroll

Why the standard

Why sustainability reporting is needed

The EU Corporate Sustainability Reporting Directive (CSRD) makes sustainability information part of the management report. The European Sustainability Reporting Standards (ESRS) set out what to disclose and how – so the figures are comparable, reliable and checked.

  1. 01

    Comparable

    Investors, banks and customers compare companies on one basis: one European standard instead of many different frameworks.

  2. 02

    Assured

    The sustainability statement is checked independently, like the financial figures – every number needs a source.

  3. 03

    Double materiality

    You report both your impact on people and the environment and how sustainability issues affect your business.

  4. 04

    Value chain

    Large companies need data from their subsidiaries and suppliers – so the request reaches smaller companies too.

  5. 05

    The rules evolve

    The EU keeps refining the requirements and data points (e.g. the 2025 simplification package). Your reporting tool has to keep up.

That is why ESG Platform lets you change the report structure yourself.

The problem

Sustainability reporting today is scattered, slow and hard to prove

  1. 1

    Data is scattered

    Dozens of spreadsheets and e-mails from every subsidiary; versions get mixed up.

  2. 2

    Requirements keep changing

    When ESRS or the materiality assessment changes, the questionnaire must be rebuilt – usually by a developer. And you are left waiting.

  3. 3

    The auditor asks for evidence

    The origin of every figure has to be explained, yet the explanations sit in e-mails, not next to the figure.
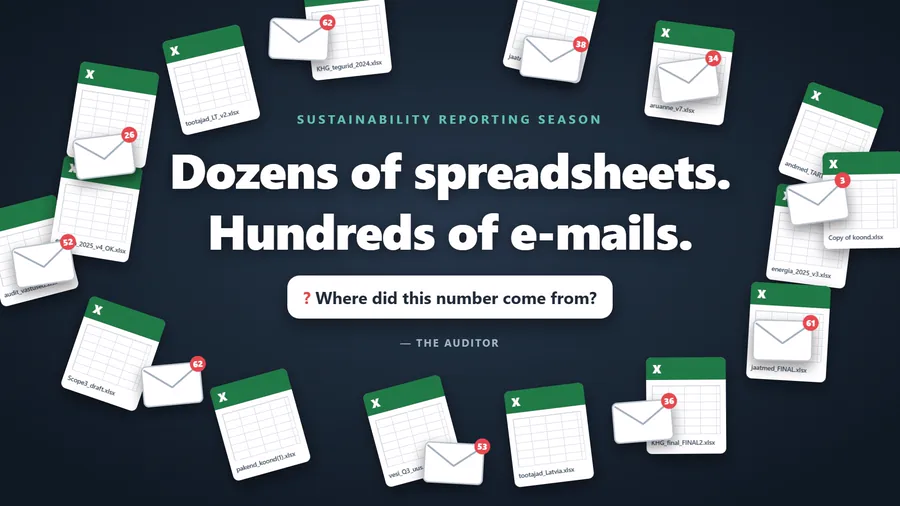
Dozens of spreadsheets and e-mails
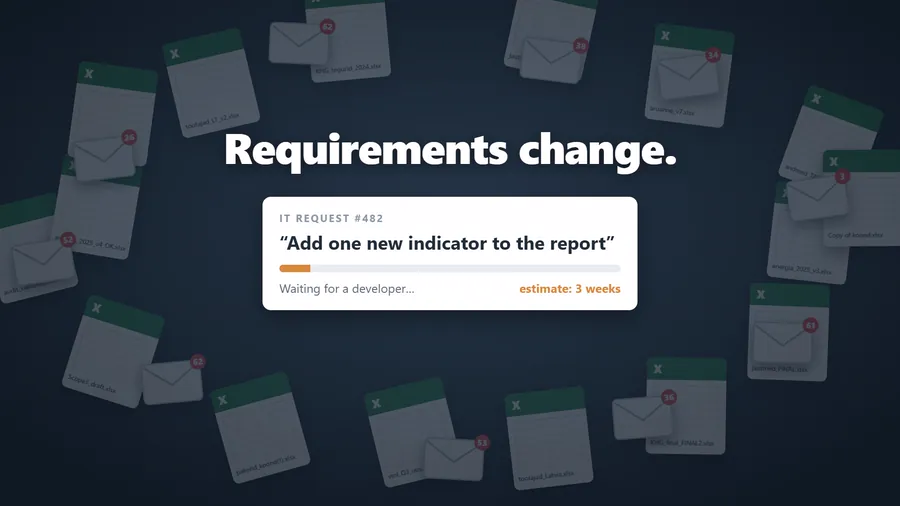
IT request: add one indicator to the report – waiting for a developer
The auditor asks: where did this number come from?

The solution

ESG Platform brings it all into one place – and puts you in control.

Before: spreadsheets and e-mail

  • Files travel by e-mail
  • Totals are compiled by hand
  • Every change is a job for a developer

With ESG Platform

  • One browser-based system for all companies
  • The group total builds itself
  • The administrator changes the content
ESG Platform – everything in one place

Content management (CMS)

It is a CMS – you are in control

Most ESG tools hand you a fixed questionnaire. Here the administrator builds and changes the content – in the browser, without a developer and without a new software release.

  1. 1

    Build your own tables and indicators

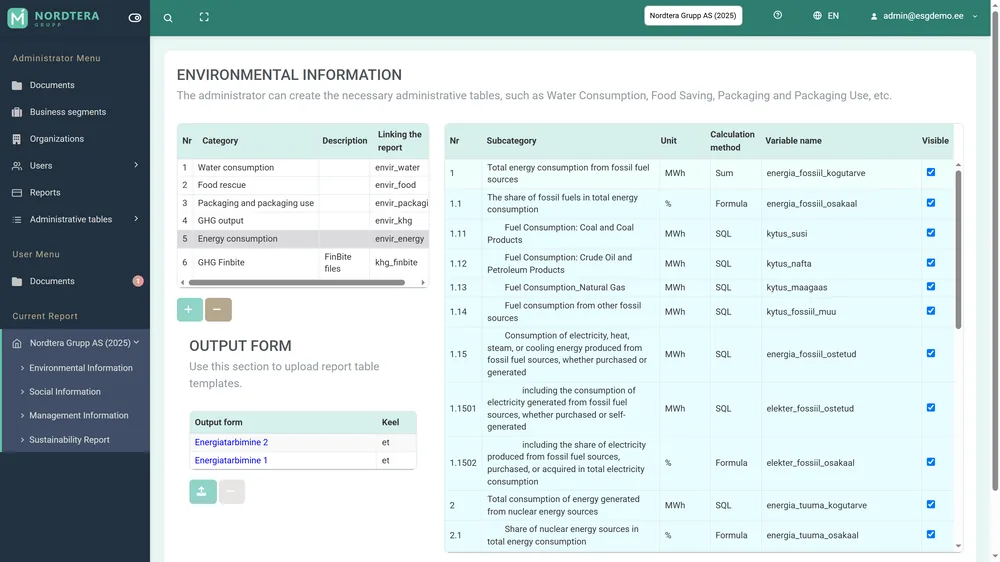
    Categories and indicators with unit, calculation method, variable name and visibility. A new indicator is visible to everyone at once.

  2. 2

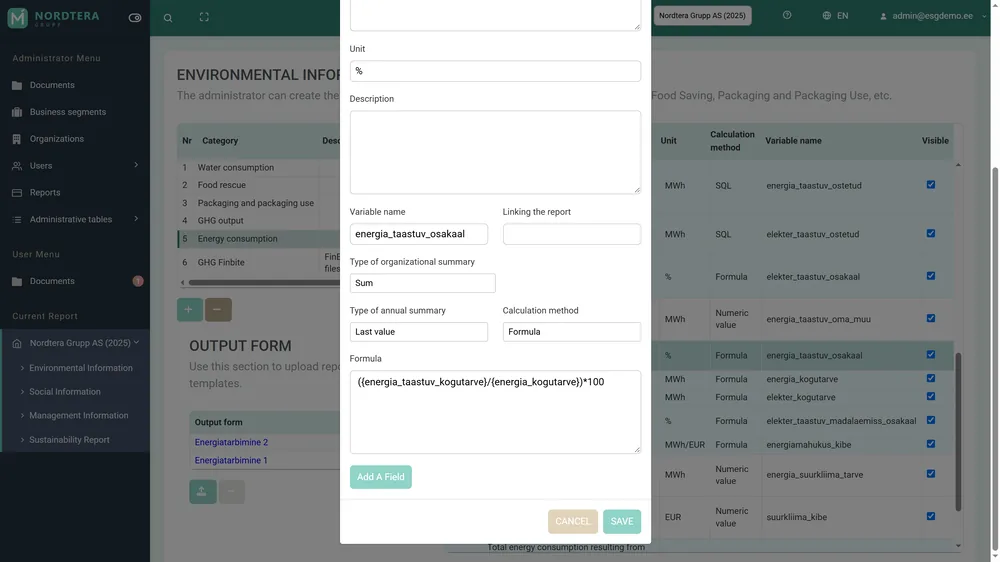
    Formulas instead of spreadsheets

    Calculated indicators are defined once by the administrator; a change applies to every organisation at once.

    ({energia_taastuv_kogutarve}/{energia_kogutarve})*100
  3. 3

    Shape the structure of the ESRS report

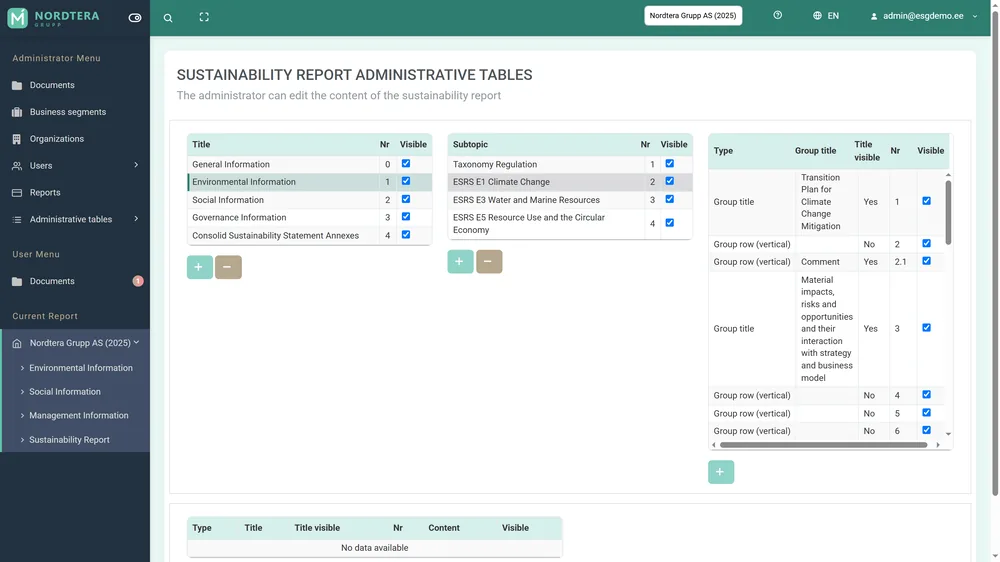
    Topics, subtopics and content groups are all editable. When the double materiality result changes, the structure follows in minutes.

  4. 4

    Users and access rights

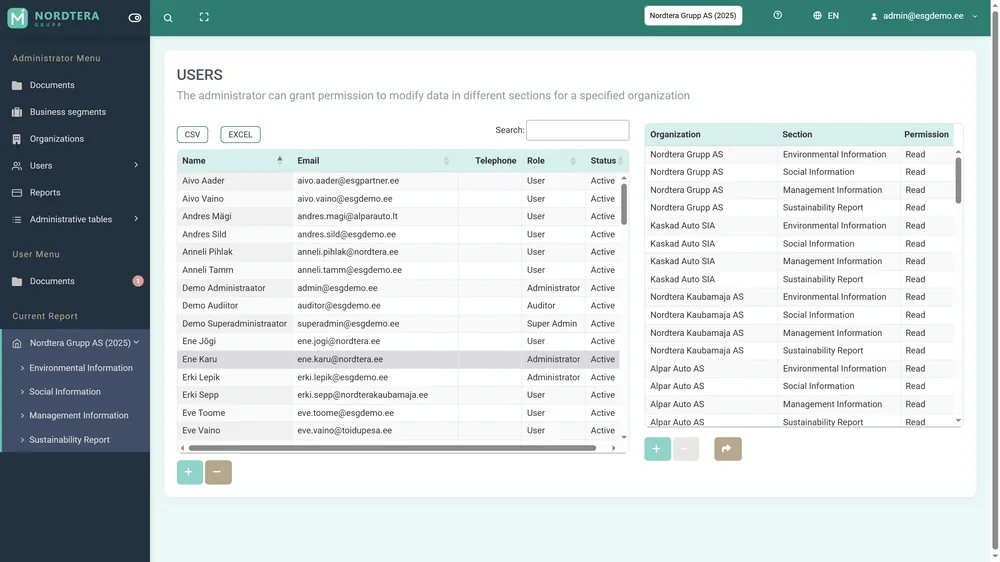
    Rights per user, per organisation and per section. Each subsidiary fills in only its own data; the group sees everything.
gis.sea.ee/esg
Administrator view: categories and indicators
gis.sea.ee/esg
Defining a formula for an indicator
gis.sea.ee/esg
Managing the ESRS report structure
gis.sea.ee/esg
Users and access rights

No programming. No waiting.

0developers needed to add a table, an indicator or a report chapter
Minutesto adapt the report when requirements change
ET · ENevery item, text and menu – and any European language can be added

Any European language

Estonian and English are built in. ESRS is a Europe-wide standard – so any European language can be added to the platform: menus, indicators, report texts.

  • ET
  • EN
  • FI
  • LV
  • LT
  • DE
  • SV
  • PL
  • FR
  • ES
  • IT
  • NL
  • DA
  • CS
  • …

built incan be added

Comparison

What makes it better

Spreadsheets and e-mailESG tool with a fixed questionnaireESG Platform
Changing the report structureBy hand in every fileThrough the vendor or a developerThe administrator, at once
Group consolidationCopied together by handDepends on the toolAutomatic
Where a figure comes fromSearched for in e-mailsOften in separate documentsComment and evidence next to the figure
Comparison with last yearWith separate formulasDepends on the toolAutomatic in every table
Calculated indicatorsFormulas spread across filesDefined by the vendorFormulas set by the administrator

A generalised comparison with typical solutions.

Data collection

Enter once – the system calculates and compares

gis.sea.ee/esg
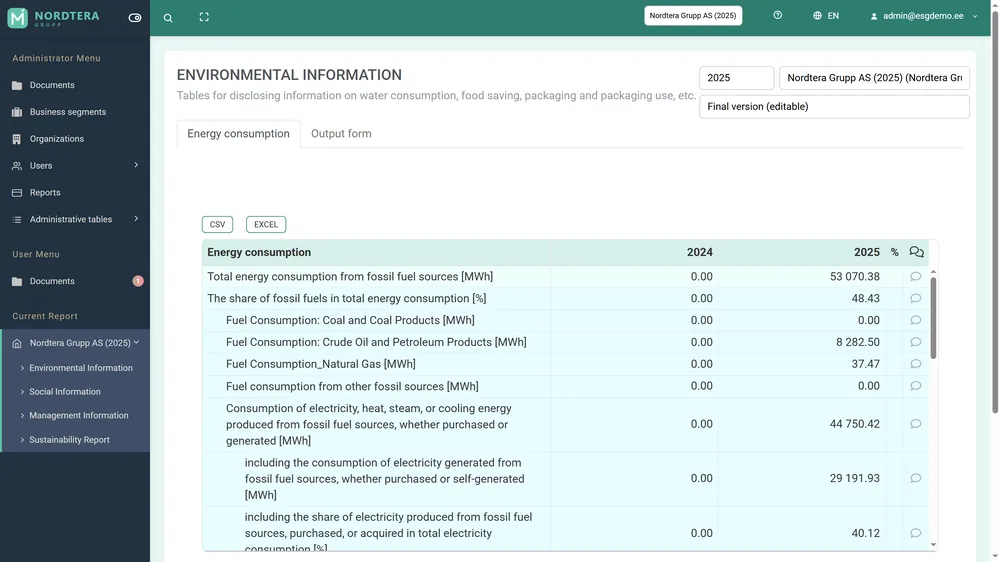
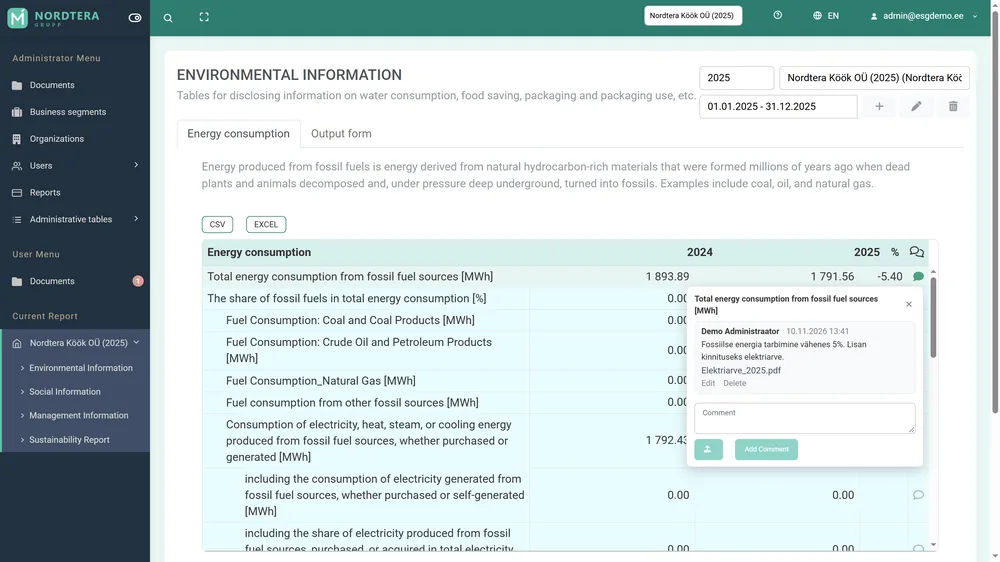
Energy consumption table with previous-year comparison

Automatic comparison with last year

Last year's value sits right next to this year's and the change in per cent is calculated for you. Big jumps stand out before the auditor sees them.
gis.sea.ee/esg
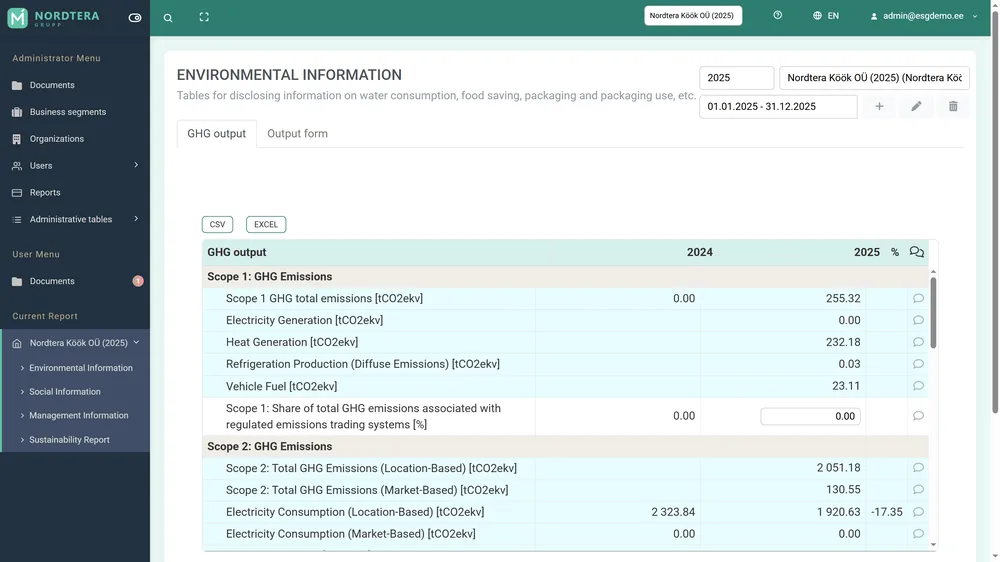
GHG results by scope

GHG calculator: Scope 1, 2 and 3

Enter quantities – emission factors apply automatically and the results are ready for ESRS E1. GHG data can also be uploaded from an Excel file.
Group consolidation

Group roll-up – automatically

Each company enters its own data. The platform rolls everything up to group level, and the group report always matches the subsidiaries' latest data.

  • Group values are summed automatically
  • “Amended” switch: the group can correct a value, and the change stays visible
  • One group, many companies, several countries
  • Nordtera Köök OÜ212
  • Toidupesa AS3 104
  • Alpar Auto AS486
  • Nordtera Kaubamaja AS1 021
  • Kaskad Auto SIA32
Nordtera Grupp AS4 855employees · 2025

Figures are illustrative (fictional demo company).

gis.sea.ee/esg
A comment with an attached invoice on a table row

Collaboration and evidence

Evidence next to every figure

Comments and evidence sit right next to every figure. Your auditor finds the answer without asking.

  • A comment thread on every row of every table
  • Attach evidence, e.g. the invoice behind a figure
  • Auditor role: reviews the data and asks in comments
  • Unread badges in the menu

The report

The ESRS report – exported to Word in your own template

The sustainability statement comes together chapter by chapter, in the same system where the data was collected.
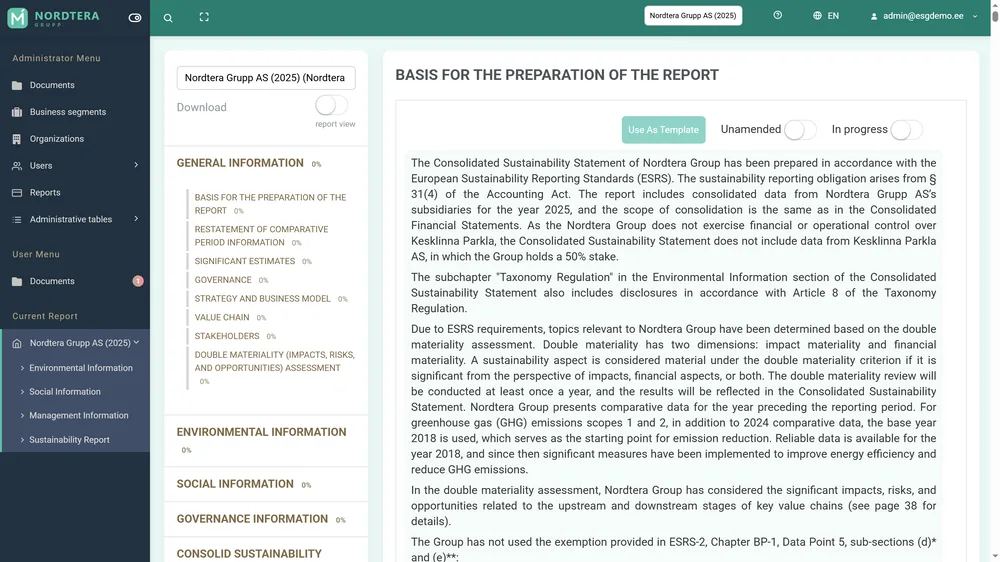
  • ESRS chapter tree with a progress percentage
  • Texts as templates: years and figures fill themselves in
  • Word export in your template – logo, styles, header
  • Excel output forms and CSV
gis.sea.ee/esg
ESRS report editor with chapters

Not just software

Software, ESG consultancy and your own structure

We don't just hand you a system. We help you understand what ESRS requires of you and build your company's own reporting structure in the platform.

1

The platform

A browser-based system for every company in the group: data, formulas, GHG, consolidation and the ESRS report in one place.

2

ESG consultancy

We explain the ESRS and CSRD requirements and help with the double materiality assessment and with choosing the data points that matter to you.

3

Your own structure

Together with you we set up the topics, tables, indicators, formulas and the Word template – and hand them over to your administrator.

The result: reporting that is truly yours – and that you can change yourself from then on.

Video and materials

See it in 90 seconds

Video transcript

Sustainability reporting season. Dozens of spreadsheets, hundreds of e-mails – and an auditor asking where every number came from. And every time the requirements change, you are left waiting for a developer. ESG Platform brings it all into one place – and puts you in control. It works like a content management system. Your administrator builds the tables and indicators. Writes the formulas. Switches report topics on and off, and decides who sees what. No programming. No waiting. Each company enters its own data. The platform compares it with last year. Calculates greenhouse gas emissions for scopes one, two and three. And rolls everything up to group level – automatically. Comments and evidence sit right next to every figure. Your auditor finds the answer without asking. The ESRS report comes together chapter by chapter, and exports to Word in your own template. Coming next: an AI assistant, data upload in any format, and a full audit log. ESG Platform. Your reporting, your structure, your rules. Try the live demo today.

Captions are built into the video.

What comes next

Planned next

PLANNEDIn the development plan – not yet in the demo.

PLANNED

AI assistant

  • Drafts report texts from your data
  • Explains changes and spots anomalies
  • Answers “where does this number come from?”
PLANNED

Data in any format

  • Excel, CSV, PDF invoices, utility and ERP exports
  • Automatic mapping to indicators
  • Preview and confirm before saving
PLANNED

Full audit log

  • Every change: who, when, old → new value
  • Undo a change in one click
  • A complete trail for the auditor

Frequently asked questions

Questions and answers

What are ESRS and CSRD?

CSRD is the EU Corporate Sustainability Reporting Directive, which makes sustainability information part of the management report. ESRS are the European Sustainability Reporting Standards that define which environmental, social and governance information to disclose, and how.

Can we change the report structure ourselves?

Yes. ESG Platform is a content management system (CMS): the administrator adds and changes topics, tables, indicators, formulas, report texts and access rights in the browser, without a developer.

Does it suit a group of companies?

Yes. Each subsidiary enters its own data and sees only its own tables; the group totals are calculated automatically.

How are greenhouse gas emissions calculated?

The GHG calculator follows the GHG Protocol structure: Scope 1, 2 and 3. Emission factors are managed centrally and applied automatically; data can also be uploaded from an Excel file.

Which languages are supported?

Estonian and English are built in everywhere – menus, indicators, report texts and e-mails. Any European language can be added.

How does the auditor use the system?

The auditor role sees the data and the evidence and can ask questions in the comments right next to each figure.

In which format is the report produced?

The ESRS report exports to Word in your own template (logo, styles, header). Tables are also available as Excel output forms and CSV.

Do you also help with the content and requirements?

Yes. Besides the software we offer ESG consultancy and build your own reporting structure in the platform together with you.

Your reporting. Your structure. Your rules.

The demo is available on request: write to us and we will send you a login. Use the same form to ask about consultancy or an offer.

Open the demo

Write to us

We use your details only to reply to you.

Sending